
雅思小作文 柱图大全
98页
1、雅思小作文 柱图,The graphs below show the types of music albums purchased by people in Britain according to sex and age.,The three bar charts describe in the percentage of the music album sales concerning three genres, namely, pop, rock and classical in the UK, and the overall purchases are divided by two categories: age and gender. It is exhibited in the graphs that the pop and rock music CDs are sold more than classical music. Whats more, as shown from the charts that men are the bigger consumers com
2、pared to their counterpart women when it comes to music. It is also worth mentioning that people ages 16 to 24 and from 35 to 44 are more fond of pop and rock On the contrary, those who are older than 45 are more interested in classical music, and their consumption accounts for 20 %, ranks the first, then the next is 17% consumed by people ages 25 to 34, followed by 3 % and o.5 % purchased by those who are 35 to 44 and 16 to 24, respectively. Finally, it must be pointed out that the biggest buye
3、r of these three kind of music is the group ages 25 to 34.,To sum up, younger people are keen on pop and rock, while classical enjoys more popularity among those who are older than 45. Nevertheless, people who are from 25 to 34 seem to appreciate all three music types.,The bar chart below shows the three main causes of land damage in four different areas.,The bar chart shows information about the areas of land damaged by human activities in four major continents of the world. The areas of land d
4、amage in Africa and Asia are similar, totaling approximately 1,200 million hectares for each, while in Australia and Europe the numbers are considerably lower, averaging between 300 and 400 million. Looking at the causes behind land damages, it can seen from the chart that in Africa, Europe and especially Australia, breeding is the leading cause of land loss, damaging approximately 500, 110 and 380 million hectares of land respectively. Next comes tree cutting which takes away slightly larger ar
《雅思小作文 柱图大全》由会员206****923分享,可在线阅读,更多相关《雅思小作文 柱图大全》请在金锄头文库上搜索。

人教版小学英语单词分类记忆汇总表excel版
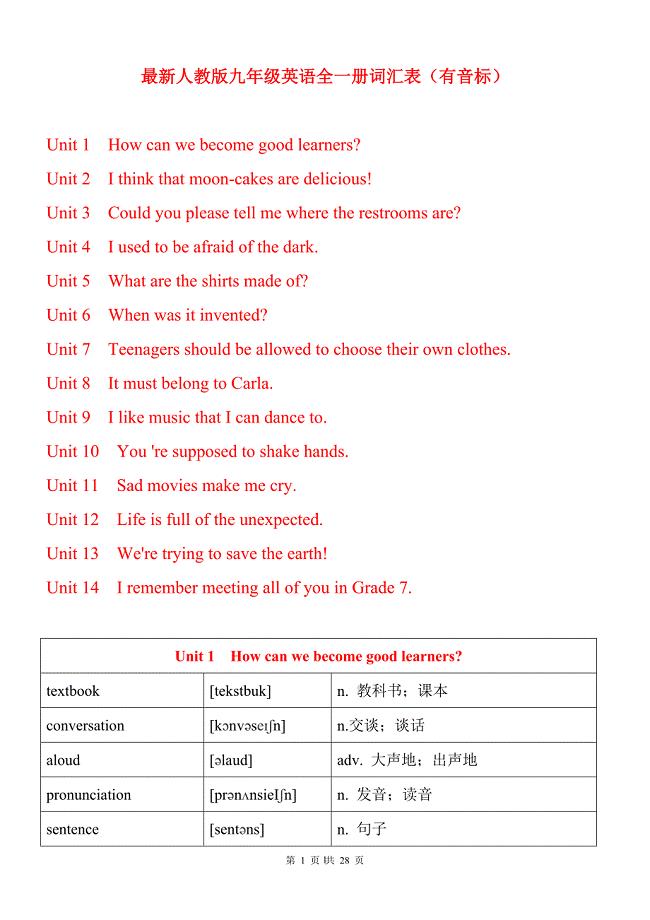
人教版九年级全一册英语词汇
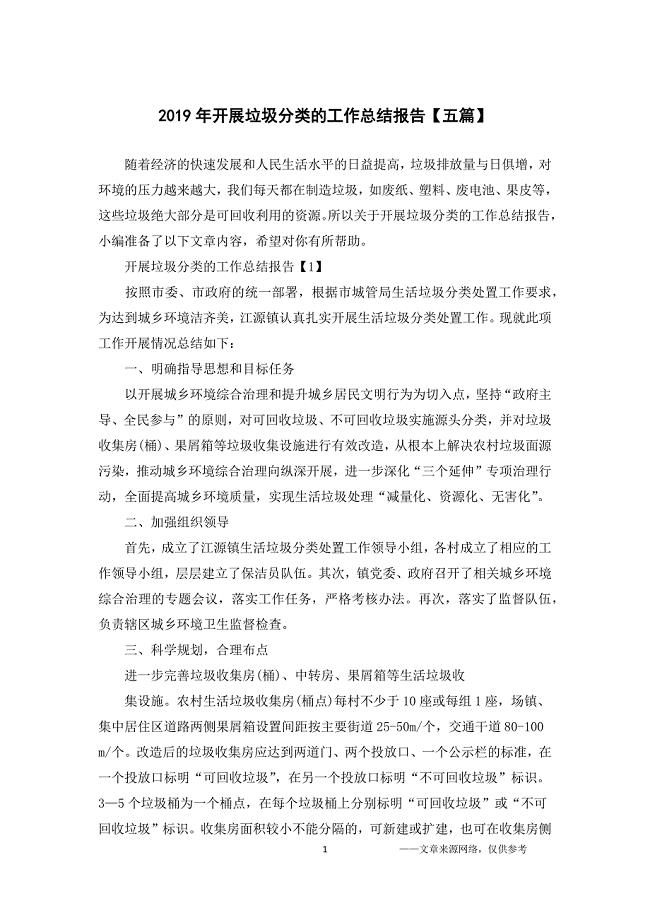
2019年开展垃圾分类的工作总结报告【五篇】
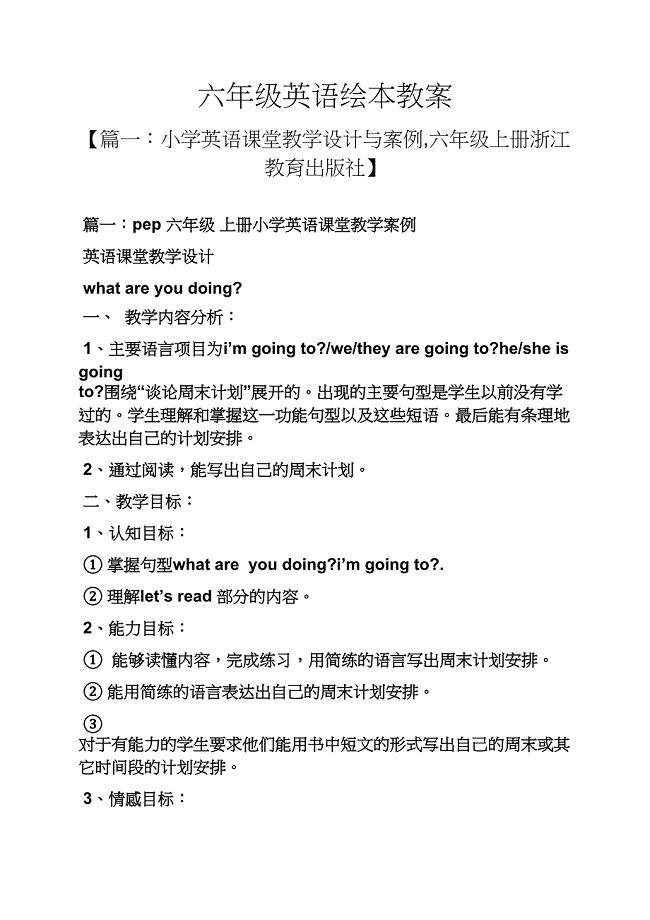
六年级英语绘本教案
外研版小学英语单词表全带音标(一年级起点1-12册)
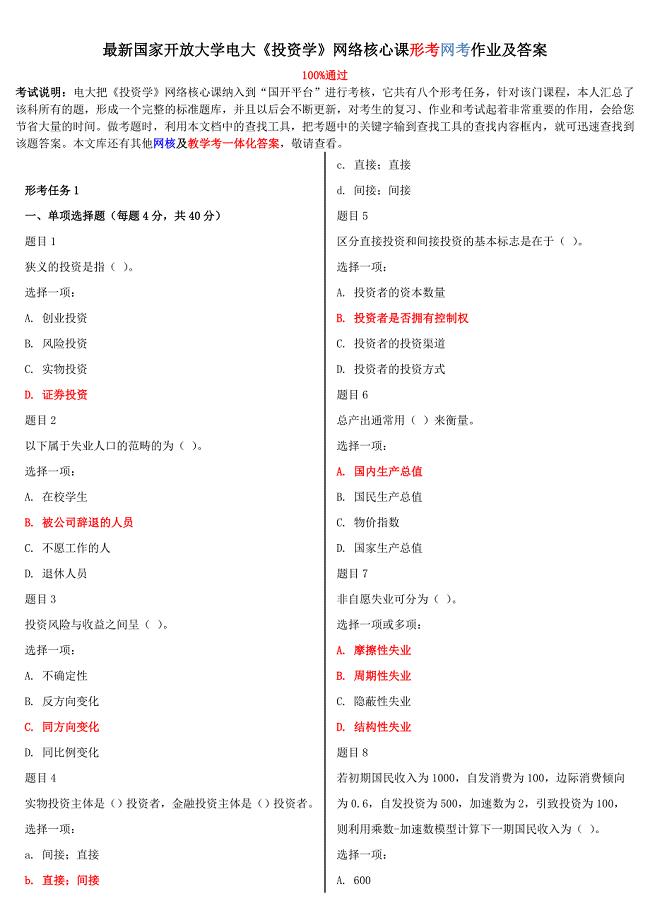
最新国家开放大学电大投资学网络核心课形考网考作业及答案
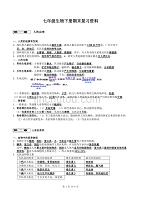
初中人教版七年级下册生物复习提纲
高中英语语法大全高中英语语法系统全解word版
☆初中英语语法专项练习习题以及答案
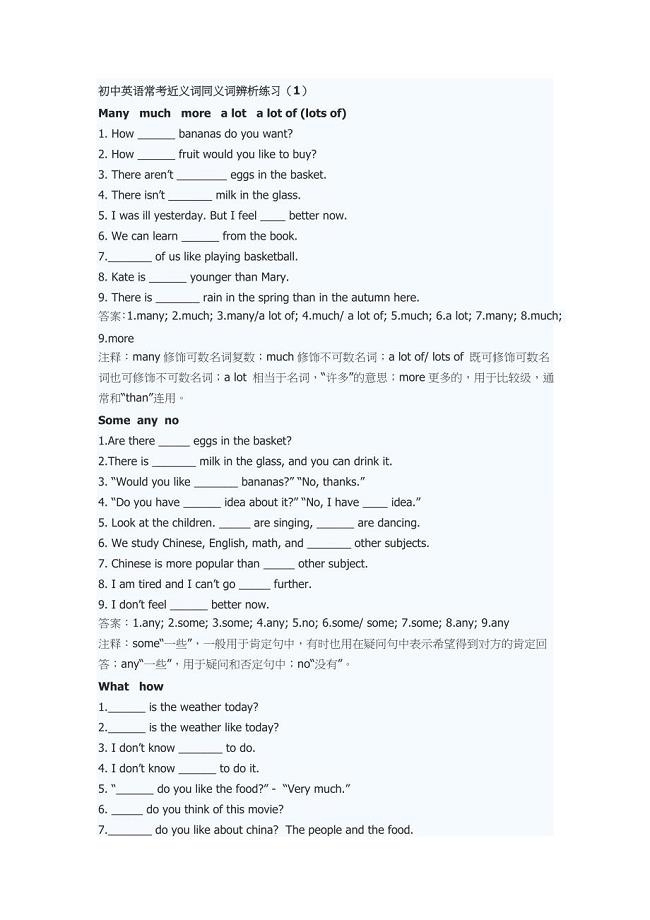
初中英语常考近义词同义词辨析
高中物理选修3-5全套教案(人教版) (1)
英语绘本《WeatherReport》教学设计
防护功能平战转换设计专篇各专业
初中人教版七年级上册下册全册生物复习提纲21页 (1)
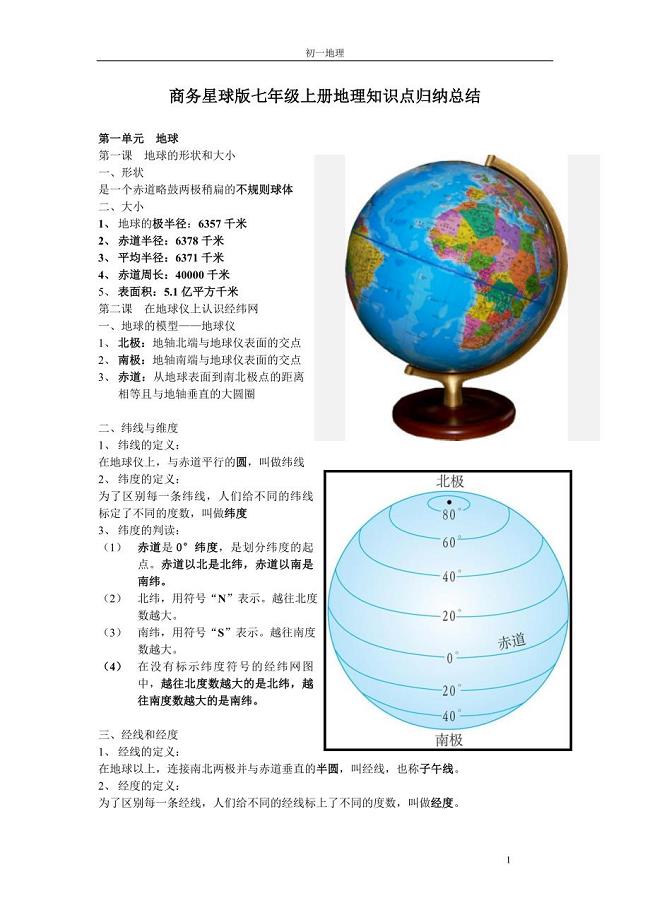
商务星球版七年级上册地理知识点归纳总结
初中人教版七年级上册下册全册生物复习提纲21页 (2)
高中高考语文作文词汇句型优美句子万能语句大全
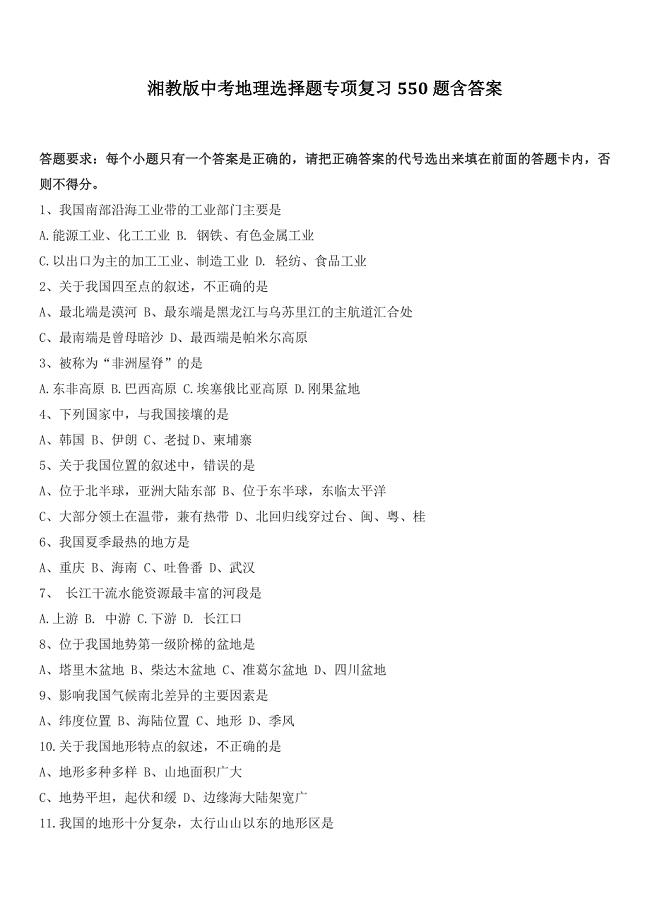
中考地理选择题专项复习550题含答案
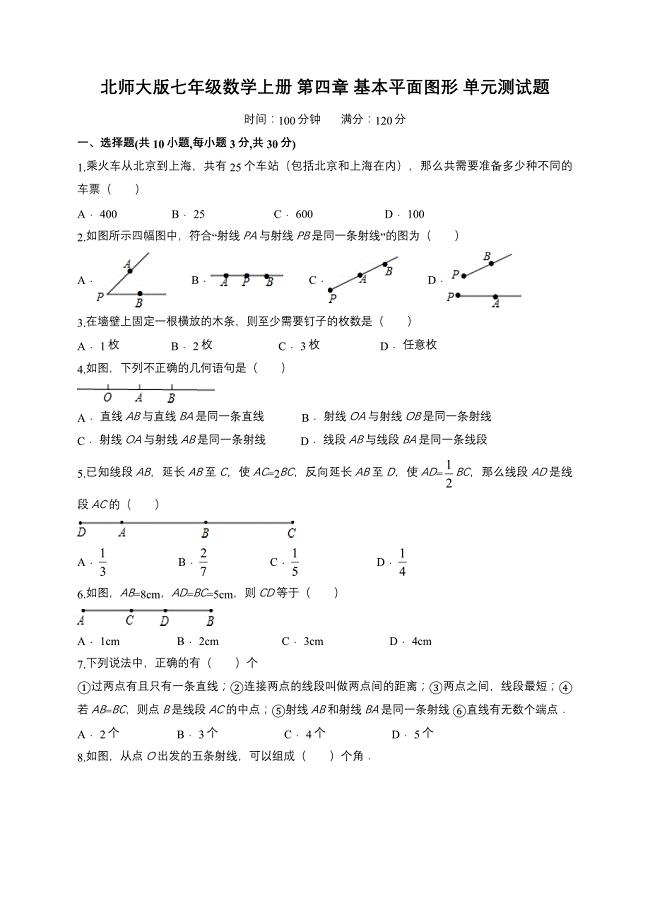
北师大版七年级数学上册第四章基本平面图形单元测试题含解析
人教版七年级数学上册第一章有理数单元检测题解析版
 开学第一课安全教育-主题班会教育教学课件
2024-04-09 29页
高中英语元宵节猜灯谜活动英文课件
2024-04-08 25页
部编版高一语文上册(必修一)《“探界者”钟扬》课件
2024-04-08 13页
部编版高一语文上册(必修一)《读书:目的和前提》课件
2024-04-08 17页
部编版高一语文上册(必修一)《喜看稻菽千重浪——记首届国家最高科技奖获得者袁隆平》课件
2024-04-08 17页
部编版高一语文上册(必修一)《立在地球边上放号》课件
2024-04-08 11页
部编版高一语文上册(必修一)《峨日朵雪峰之侧》课件
2024-04-08 14页
部编版高一语文上册(必修一)《沁园春长沙》课件
2024-04-08 17页
部编版高一语文上册(必修一)《拿来主义》课件
2024-04-08 15页
部编版高一语文上册(必修一)《红烛》课件
2024-04-08 16页