
图表描述第二讲
11页
1、图表描述第二讲1.3 饼状图1.3.1 一个饼例题1The pie chart below shows the average weekly expenditure per family in Britain (1996).最多三项,最少三项,分别占?,加起来占?。或者把饼块分类,分别介绍不同的饼块。It is not surprising that the most expensive (adj.) component is A, which accounts for m% of all x. B is the next largest expenditure (n.), n% lower than A of all x and followed closely by C. The above three items of ? take up about o% of the x.By contrast, D, E and F make up the smallest percentage of total x, which are p%, q% and r%, respectivel
2、y.1.3.2 两个饼基本思路是:每个饼块在两个饼中排名第?,占?%。但如果一个一个说,就会是流水帐。所以饼块要分类,分类的方法是:从左饼到右饼,上升的是一类,下降的是一类,保持不变的是一类。要写清楚变化的含义。在每一段中,再具体描写每个饼块,突出这些饼块的特点。如果饼状图除了交代百分比以外,还有数量,请在首段描述完四要素以后,把两个饼的数量比较一下。例题1The pie charts below show the area and current population of the seven continents as a percentage of the total. Write a report for a university lecturer describing the information shown below. The pie charts show the seven continents of the world and the percentage of the total land mass of the globe that they occupy t
3、ogether with the percentage of the worlds population they are home to. The densely populated continents are Asia and Europe, both having about twice the population that could be expected were the global population evenly distributed over the global land mass. Asia is the largest continent in terms of both area (30%) and population (61%). Europe (with 7% of the area and 12% of the population) is the second smallest continent, yet has a population almost as high as that of Africa, a continent whic
4、h is three larger in area. Africa and the Americas are relatively sparsely populated continents. North America (16% of the area and 8% of the population) and South America (12% of the area and 5.5% of the population) have population equal to about half of what could be expected if the global population were evenly distributed, whilst Africas population is about a third lower than would be expected in such a situation (20% of the area and 13% of the population). The smallest continent, Oceania (w
《图表描述第二讲》由会员新**分享,可在线阅读,更多相关《图表描述第二讲》请在金锄头文库上搜索。

2022年内审分管领导讲话范本
《爱的教育》读后感范文
工程建设项目超概现象浅谈
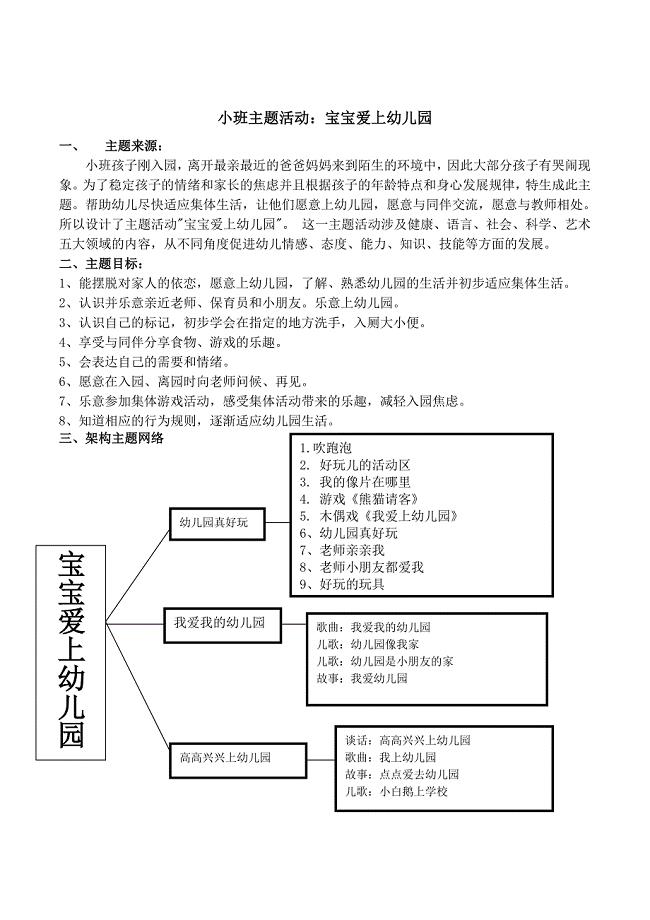
小班主题活动:宝宝爱上幼儿园
信用社(银行)财税库银横向联网业务管理暂行办法
反腐倡廉培训班备课资料
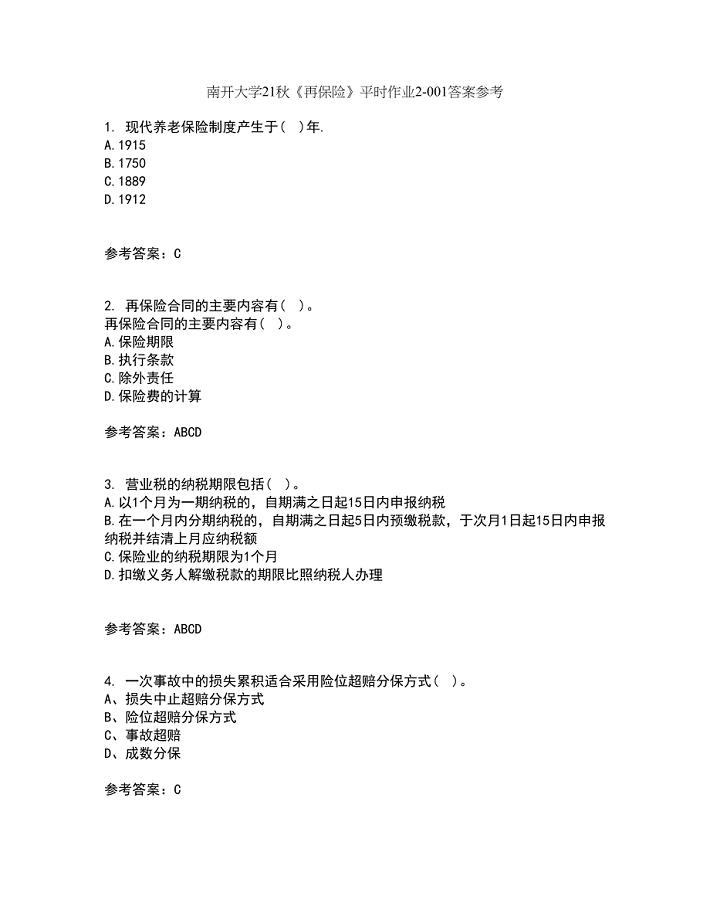
南开大学21秋《再保险》平时作业2-001答案参考4
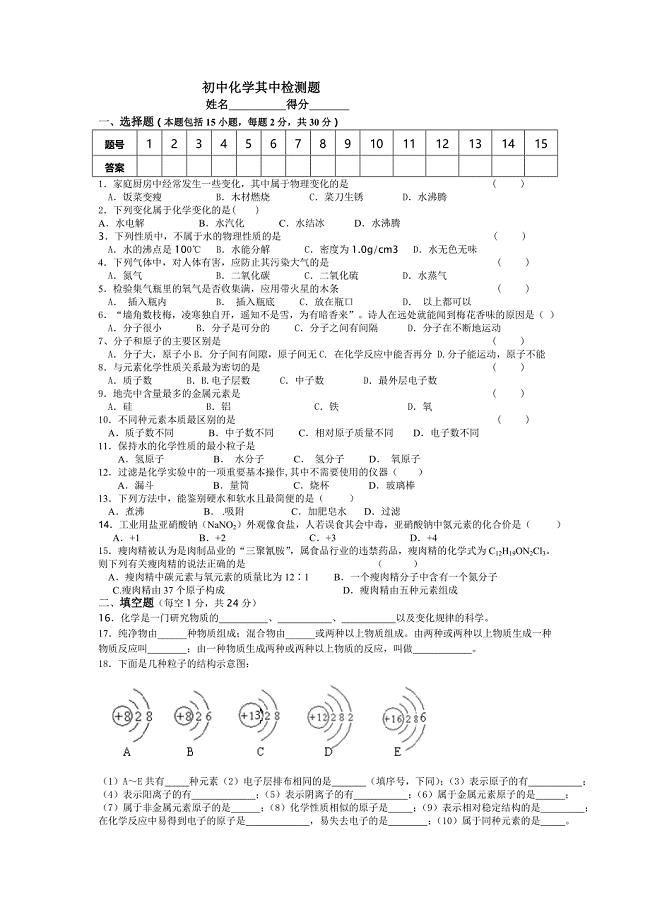
初中化学其中检测题
垃圾处理合作协议新
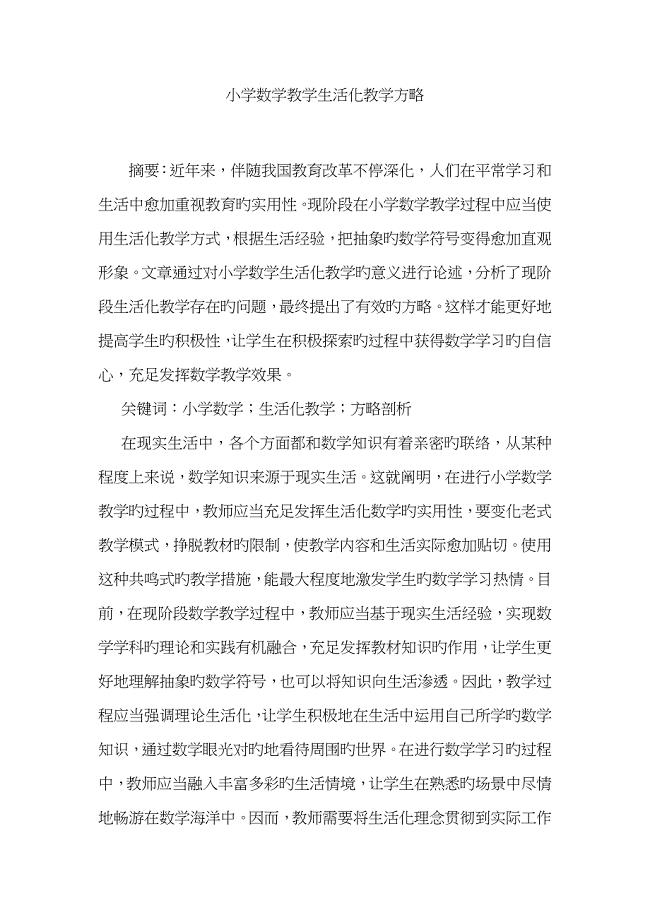
小学数学教学生活化教学策略
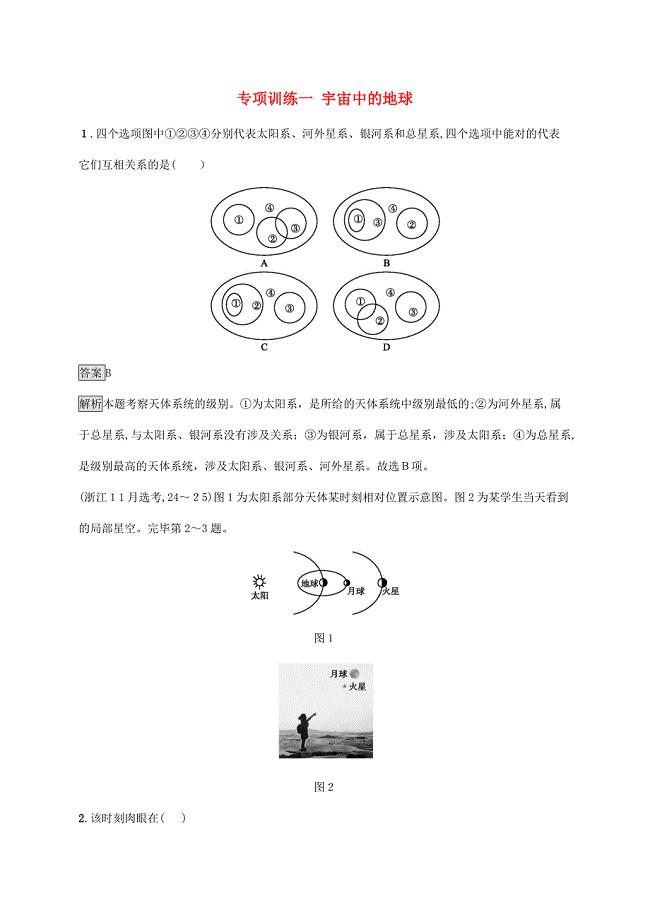
(浙江选考)高考地理大二轮复习-专题一-宇宙中的地球专题训练
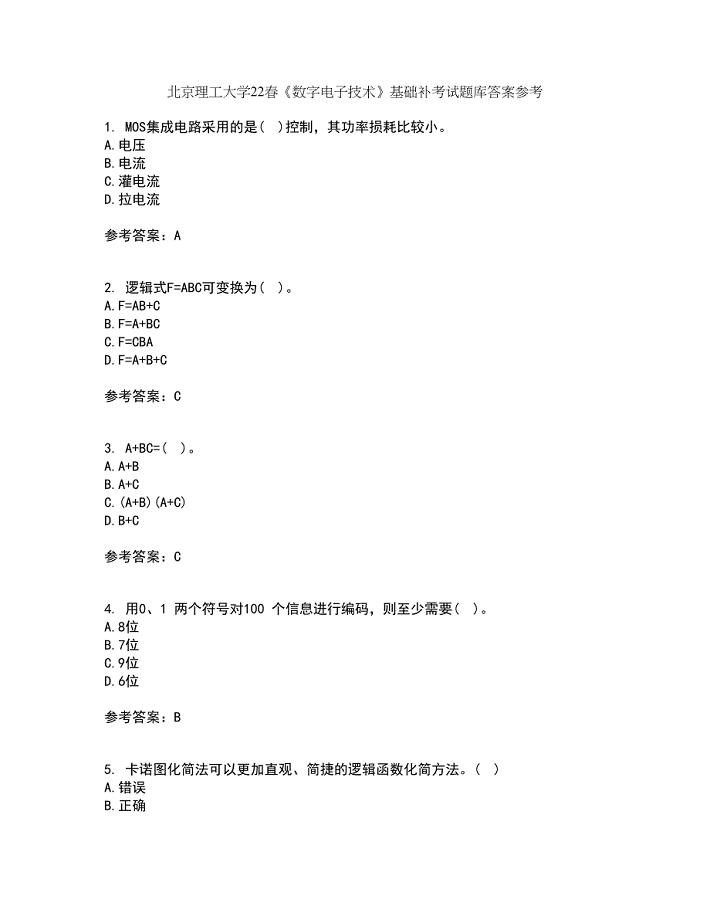
北京理工大学22春《数字电子技术》基础补考试题库答案参考16
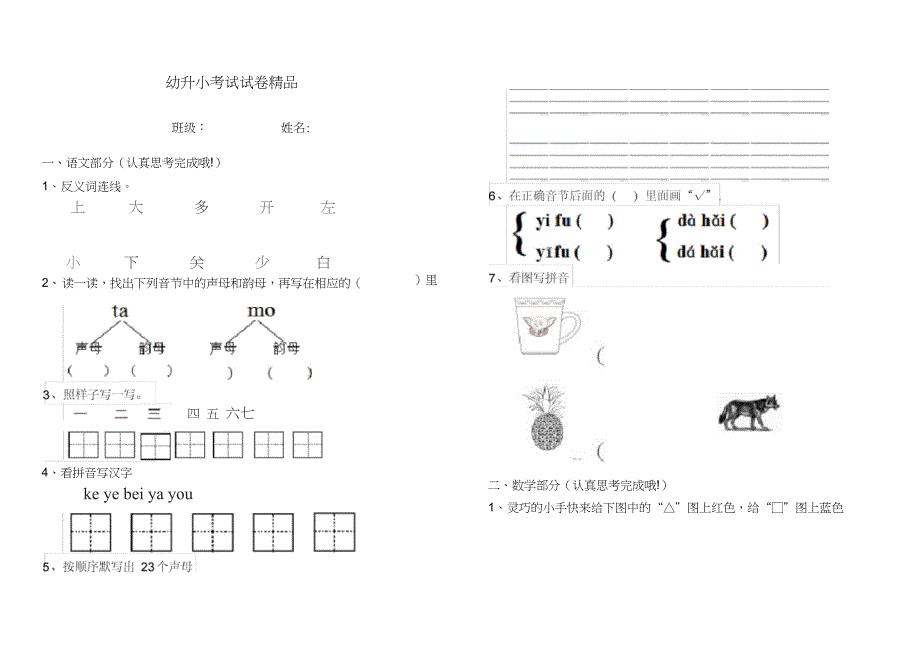
幼升小考试试卷精品
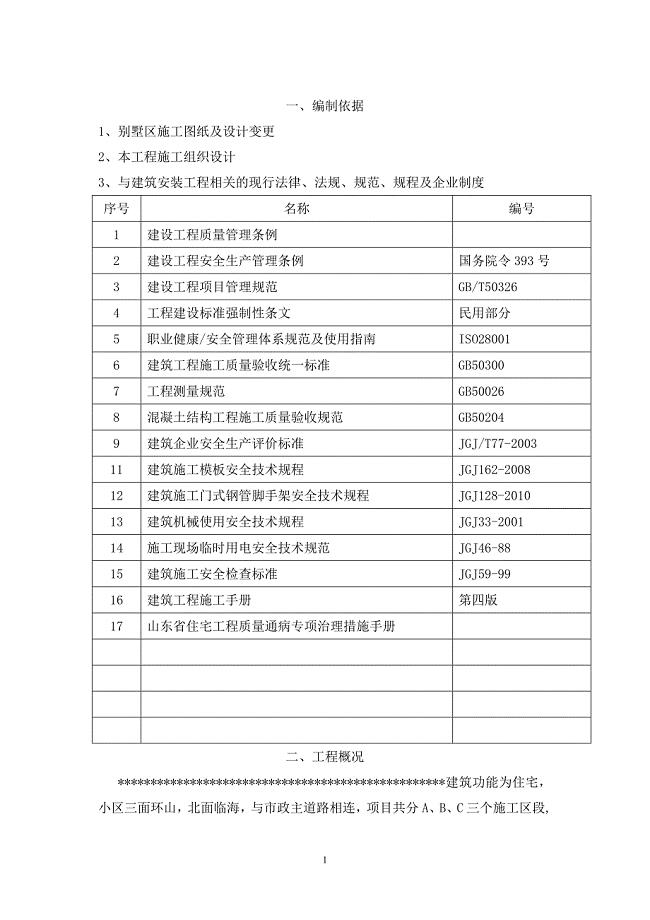
门式脚手架施工方案
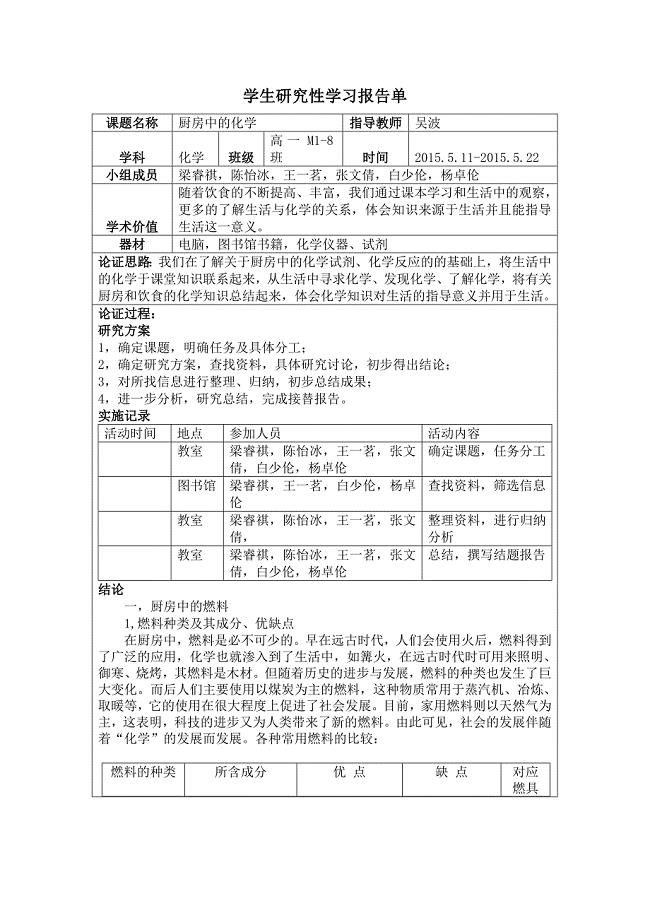
化学研究性学习报告
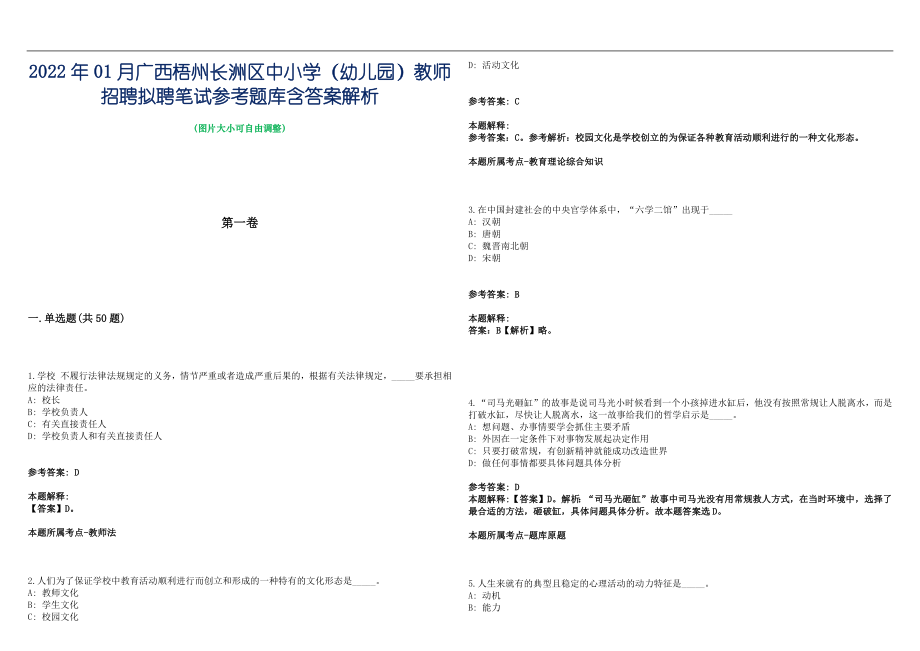
2022年01月广西梧州长洲区中小学(幼儿园)教师招聘拟聘笔试参考题库含答案解析篇

公司年会的演讲稿3篇
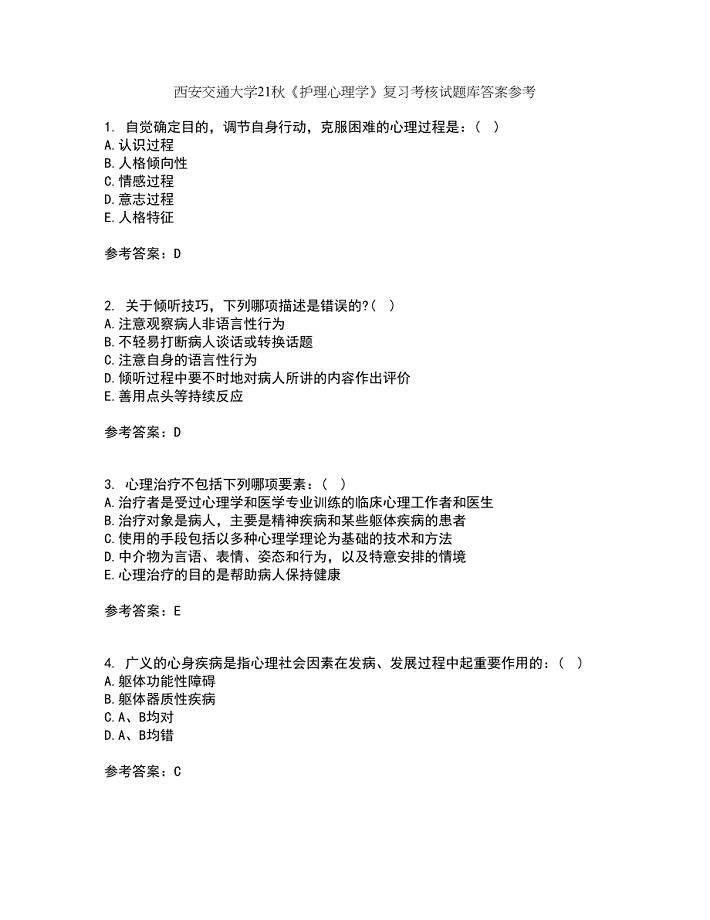
西安交通大学21秋《护理心理学》复习考核试题库答案参考套卷30
读好书、求新知活动总结
保温材料用途介绍
 第五单元提升练习
2023-08-23 4页
雷州西湖心得体会社会实践
2024-03-05 10页
幼儿园小班劳动节活动方案资料
2022-10-01 3页
1.2.4.1生产与经济制度教案
2023-11-17 2页
煤矿重大事故隐患判定标准条文释义
2023-06-12 75页
甘肃省会宁太平八年级生物上册17.2动物的运动依赖于一定的结构导学案无答案新版苏教版
2023-09-19 2页
八年级数学上册3.3轴对称与坐标变化教案新版北师大版
2023-02-27 5页
病人接待流程
2023-03-20 5页
重庆市景观园林设计收费标准
2022-08-01 15页
医院医疗保险年终工作总结
2024-02-11 2页