电子文档交易市场
安卓APP | ios版本
电子文档交易市场
安卓APP | ios版本

simon 小作文

40页
  • 卖家[上传人]:小**
  • 文档编号:89489051
  • 上传时间:2019-05-25
  • 文档格式:DOC
  • 文档大小:2.01MB
  • / 40 举报 版权申诉 马上下载
  • 文本预览
  • 下载提示
  • 常见问题
    • 1、The table below shows the amount of waste production (in millions of tones) in six different countries over a twenty-year period.The chart compares the amounts of waste that were produced in six countries in the years 1980, 1990 and 2000.In each of these years, the US produced more waste than Ireland, Japan, Korea, Poland and Portugal combined. It is also noticeable that Korea was the only country that managed to reduce its waste output by the year 2000.Between 1980 and 2000, waste production in

      2、 the US rose from 131 to 192 million tones, and rising trends were also seen in Japan, Poland and Portugal. Japans waste output increased from 28 to 53 million tones, while Poland and Portugal saw waste totals increase from 4 to 6.6 and from 2 to 5 million tones respectively.The trends for Ireland and Korea were noticeably different from those described above. In Ireland, waste production increased more than eightfold, from only 0.6 million tones in 1980 to 5 million tones in 2000. Korea, by con

      3、trast, cut its waste output by 12 million tones between 1990 and 2000.The diagrams compare two different methods of defence for homes which are at risk of being flooded.The key difference between the diagrams is that they show flood protection with and without a stopbank. In either case, the at-risk home is raised on stilts above ground level.The first diagram shows how a stopbank acts as a flood barrier to stop river water from flooding homes. The stopbank is a small mound of land next to the r

      4、iver that is higher than the 100-year flood level, and prevents the river from bursting its banks. Nearby houses can be built on stilts to prevent flooding from rainwater, and a floodgate beneath the stopbank can be opened to allow this ponding to drain off into the river.When there is no stopbank, as shown in the second diagram, there will be nothing to stop the river from flooding. In this case, the solution is to put buildings on stilts. The height of the stilts is measured so that the floor

      5、of the house is 300mm above the 100-year flood level. This measurement is called the freeboard. The diagrams compare two different methods of defence for homes which are at risk of being flooded.The key difference between the diagrams is that they show flood protection with and without a stopbank. In either case, the at-risk home is raised on stilts above ground level.The first diagram shows how a stopbank acts as a flood barrier to stop river water from flooding homes. The stopbank is a small m

      6、ound of land next to the river that is higher than the 100-year flood level, and prevents the river from bursting its banks. Nearby houses can be built on stilts to prevent flooding from rainwater, and a floodgate beneath the stopbank can be opened to allow this ponding to drain off into the river.When there is no stopbank, as shown in the second diagram, there will be nothing to stop the river from flooding. In this case, the solution is to put buildings on stilts. The height of the stilts is m

      7、easured so that the floor of the house is 300mm above the 100-year flood level. This measurement is called the freeboard.The graph below shows changes in young adult unemployment rates in England between 1993 and 2012.Introduction and overview paragraphs:The line graph compares levels of unemployment among 16 to 24-year-olds with overall unemployment figures over a period of 20 years in England.It is clear that the proportion of young adults who were unemployed at any time between 1993 and 2012

      8、was significantly higher than the overall proportion of adults without work. Unemployment rates for both groups of adults were consistently higher in London than in the rest of England.The table below shows changes in the numbers of residents cycling to work in different areas of the UK between 2001 and 2011.The table compares the numbers of people who cycled to work in twelve areas of the UK in the years 2001 and 2011.Overall, the number of UK commuters who travelled to work by bicycle rose con

      9、siderably over the 10-year period. Inner London had by far the highest number of cycling commuters in both years.In 2001, well over 43 thousand residents of inner London commuted by bicycle, and this figure rose to more than 106 thousand in 2011, an increase of 144%. By contrast, although outer London had the second highest number of cycling commuters in each year, the percentage change, at only 45%, was the lowest of the twelve areas shown in the table.Brighton and Hove saw the second biggest increase (109%) in the number of residents cycling to work, but Bristol was the UKs second city in terms of total numbers of cycling commuters, with 8,108 in 2001 and 15,768 in 2011. Figures for the other eight areas were below the 10 thousand mark in both years.The diagram below shows how solar panels can be used to provide electricity for domestic use.The picture illustrates the process of producing el

      《simon 小作文》由会员小**分享,可在线阅读,更多相关《simon 小作文》请在金锄头文库上搜索。
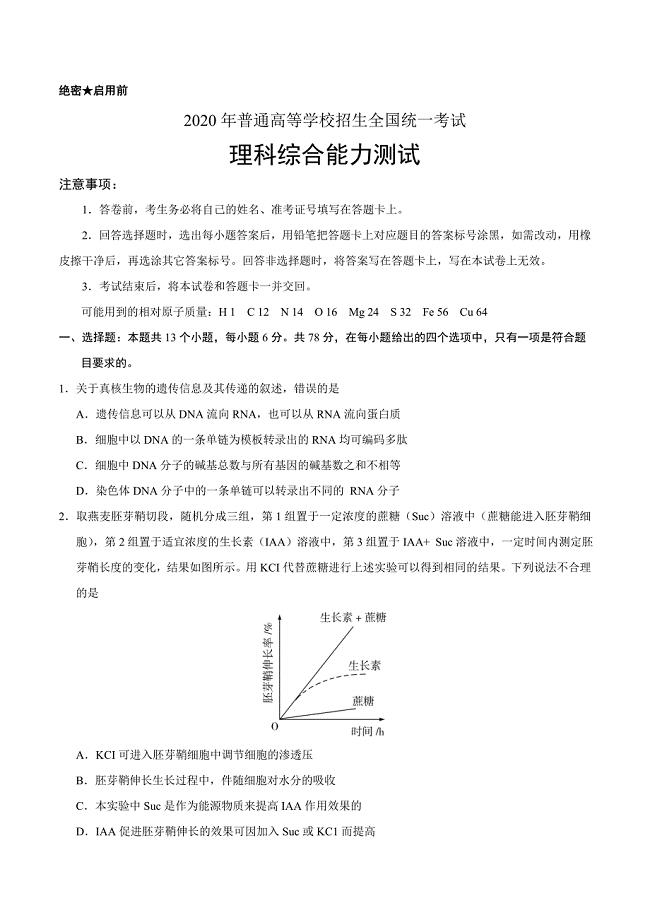
      点击阅读更多内容
    最新标签
    发车时刻表 长途客运 入党志愿书填写模板精品 庆祝建党101周年多体裁诗歌朗诵素材汇编10篇唯一微庆祝 智能家居系统本科论文 心得感悟 雁楠中学 20230513224122 2022 公安主题党日 部编版四年级第三单元综合性学习课件 机关事务中心2022年全面依法治区工作总结及来年工作安排 入党积极分子自我推荐 世界水日ppt 关于构建更高水平的全民健身公共服务体系的意见 空气单元分析 哈里德课件 2022年乡村振兴驻村工作计划 空气教材分析 五年级下册科学教材分析 退役军人事务局季度工作总结 集装箱房合同 2021年财务报表 2022年继续教育公需课 2022年公需课 2022年日历每月一张 名词性从句在写作中的应用 局域网技术与局域网组建 施工网格 薪资体系 运维实施方案 硫酸安全技术 柔韧训练 既有居住建筑节能改造技术规程 建筑工地疫情防控 大型工程技术风险 磷酸二氢钾 2022年小学三年级语文下册教学总结例文 少儿美术-小花 2022年环保倡议书模板六篇 2022年监理辞职报告精选 2022年畅想未来记叙文精品 企业信息化建设与管理课程实验指导书范本 草房子读后感-第1篇 小数乘整数教学PPT课件人教版五年级数学上册 2022年教师个人工作计划范本-工作计划 国学小名士经典诵读电视大赛观后感诵读经典传承美德 医疗质量管理制度 2 2022年小学体育教师学期工作总结 2022年家长会心得体会集合15篇
    关于金锄头网 - 版权申诉 - 免责声明 - 诚邀英才 - 联系我们
    手机版 | 川公网安备 51140202000112号 | 经营许可证(蜀ICP备13022795号)
    ©2008-2016 by Sichuan Goldhoe Inc. All Rights Reserved.